[et_pb_section bb_built=”1″ admin_label=”section”][et_pb_row background_position=”top_left” background_repeat=”repeat” background_size=”initial”][et_pb_column type=”4_4″][et_pb_text admin_label=”Paragraph 1″ background_layout=”light” text_orientation=”justified” text_font_size=”16″ text_line_height=”1.9em” use_border_color=”off” custom_margin=”-25px|||” custom_padding=”||10px|” background_position=”top_left” background_repeat=”repeat” background_size=”initial” _builder_version=”3.0.96″]
Surface plasmon resonance (SPR) can be used to analyze all types of interactions ranging from protein-protein, protein-small molecule, antibody-antigen, protein-nucleic acid, protein-aptamer, protein-lipid, protein-carbohydrate and many more. One major area of research is the study of protein-protein binding kinetics because it helps researchers understand biological processes involving millions of proteins. Many scientists are implementing techniques such as SPR to define the kinetic constants of these types of interactions.
[/et_pb_text][/et_pb_column][/et_pb_row][et_pb_row background_position=”top_left” background_repeat=”repeat” background_size=”initial”][et_pb_column type=”4_4″][et_pb_text admin_label=”Paragraph 2″ background_layout=”light” text_font_size=”16″ text_line_height=”1.9em” use_border_color=”off” custom_margin=”-20px|||” background_position=”top_left” background_repeat=”repeat” background_size=”initial” _builder_version=”3.0.96″]
[/et_pb_text][et_pb_text admin_label=”Paragraph 2″ background_layout=”light” text_orientation=”left” text_font_size=”16″ text_line_height=”1.9em” use_border_color=”off” border_color=”#ffffff” border_style=”solid” custom_margin=”-20px|||” background_position=”top_left” background_repeat=”repeat” background_size=”initial” _builder_version=”3.0.96″]
Why do we study protein-protein interactions?
[/et_pb_text][/et_pb_column][/et_pb_row][et_pb_row background_position=”top_left” background_repeat=”repeat” background_size=”initial”][et_pb_column type=”4_4″][et_pb_text admin_label=”Paragraph 3″ background_layout=”light” text_font_size=”16″ text_line_height=”1.9em” use_border_color=”off” custom_margin=”-20px|||” background_position=”top_left” background_repeat=”repeat” background_size=”initial” _builder_version=”3.0.96″]
Characterizing protein interactions is absolutely vital for understanding disease pathways, metabolism, signal transduction, membrane transport, virulence, and discovery of therapeutic targets. There are millions of protein interactions taking place at any given time, in any given cell, and in any living organism that serves to maintain essential processes governing homeostasis.
[/et_pb_text][/et_pb_column][/et_pb_row][et_pb_row background_position=”top_left” background_repeat=”repeat” background_size=”initial”][et_pb_column type=”4_4″][et_pb_text admin_label=”Paragraph 2″ background_layout=”light” text_font_size=”16″ text_line_height=”1.9em” use_border_color=”off” custom_margin=”-20px|||” background_position=”top_left” background_repeat=”repeat” background_size=”initial” _builder_version=”3.0.96″]
[/et_pb_text][et_pb_text admin_label=”Paragraph 2″ background_layout=”light” text_orientation=”left” text_font_size=”16″ text_line_height=”1.9em” use_border_color=”off” border_color=”#ffffff” border_style=”solid” custom_margin=”-20px|||” background_position=”top_left” background_repeat=”repeat” background_size=”initial” _builder_version=”3.0.96″]
Why do researchers use SPR to characterize protein-protein interactions?
[/et_pb_text][/et_pb_column][/et_pb_row][et_pb_row background_position=”top_left” background_repeat=”repeat” background_size=”initial”][et_pb_column type=”4_4″][et_pb_text admin_label=”Paragraph 3″ background_layout=”light” text_font_size=”16″ text_line_height=”1.9em” use_border_color=”off” custom_margin=”-20px|||” background_position=”top_left” background_repeat=”repeat” background_size=”initial” _builder_version=”3.0.96″]
When characterizing protein interactions involved with disease, signaling, or metabolic pathways, researchers have typically relied on affinity-based, qualitative techniques that only provide endpoint measurements, namely CoIPs, ELISAs, or Yeast two-hybrid assays. Other techniques such as BLI, ITC, or MST will provide quantitative binding data but will come with a number of drawbacks including lower reproducibility, high sample consumption, or labeling requirements.
In contrast, SPR provides highly reproducible, label-free, quantitative binding data with very low sample consumption. SPR allows researchers to determine the kon, koff and KD of interactions and will provide significantly deeper insight into binding events.
[/et_pb_text][/et_pb_column][/et_pb_row][et_pb_row background_position=”top_left” background_repeat=”repeat” background_size=”initial”][et_pb_column type=”4_4″][et_pb_text admin_label=”Paragraph 2″ background_layout=”light” text_font_size=”16″ text_line_height=”1.9em” use_border_color=”off” custom_margin=”-20px|||” background_position=”top_left” background_repeat=”repeat” background_size=”initial” _builder_version=”3.0.96″]
[/et_pb_text][et_pb_text admin_label=”Paragraph 2″ background_layout=”light” text_orientation=”left” text_font_size=”16″ text_line_height=”1.9em” use_border_color=”off” border_color=”#ffffff” border_style=”solid” custom_margin=”-20px|||” background_position=”top_left” background_repeat=”repeat” background_size=”initial” _builder_version=”3.0.96″]
Example of a protein-protein interaction analyzed using OpenSPR™
[/et_pb_text][/et_pb_column][/et_pb_row][et_pb_row background_position=”top_left” background_repeat=”repeat” background_size=”initial”][et_pb_column type=”4_4″][et_pb_text admin_label=”Paragraph 3″ background_layout=”light” text_font_size=”16″ text_line_height=”1.9em” use_border_color=”off” custom_margin=”-20px|||” background_position=”top_left” background_repeat=”repeat” background_size=”initial” _builder_version=”3.0.96″]
Below is an example of how the OpenSPR 2-channel instrument was used to characterize binding kinetics of Protein A interacting with an IgG antibody. Protein A is a virulence factor produced by S. aureus that promotes immune system evasion by tightly binding to the Fc region of IgG antibodies. Following comprehensive, step-by-step instructions from the OpenSPR’s Ligand Immobilization Wizard software, a carboxyl sensor chip was cleaned and activated on both channels. In this experiment, Channel 1 was used as the reference channel and Channel 2 was used as the sensor channel with immobilized Protein A.
Upon immobilization of Protein A on Channel 2, both channels were blocked to eliminate nonspecific binding. Four concentrations of human IgG were prepared and injected across both channels and the binding kinetics and affinity were calculated using a 1:1 binding model in TraceDrawer analysis software. The figure and table below demonstrate how the 2-channel OpenSPR is able to easily generate high quality and highly reproducible data by simultaneously removing any drift and/or nonspecific binding via a reference channel. You can find the full application note here.
[/et_pb_text][/et_pb_column][/et_pb_row][et_pb_row background_position=”top_left” background_repeat=”repeat” background_size=”initial”][et_pb_column type=”4_4″]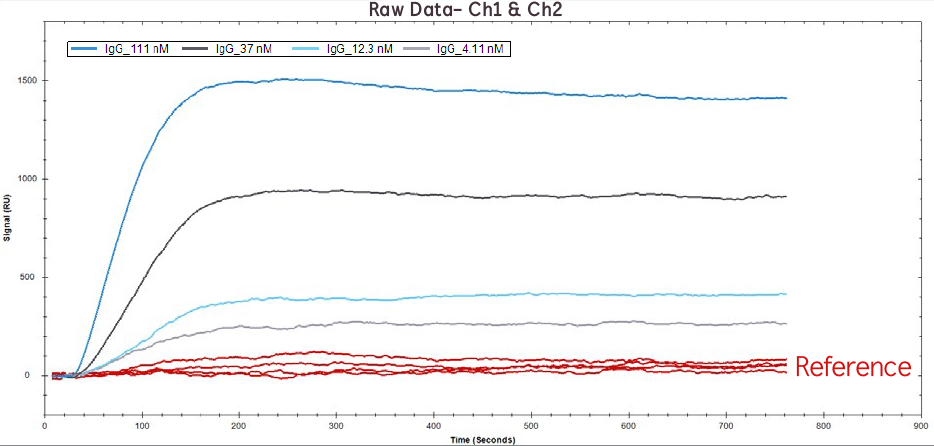 [et_pb_text admin_label=”Quote” background_layout=”light” text_orientation=”left” text_font_size=”16″ text_line_height=”1.9em” use_border_color=”off” border_color=”#ffffff” border_style=”solid” custom_margin=”-20px|||” background_position=”top_left” background_repeat=”repeat” background_size=”initial” _builder_version=”3.0.96″]
[/et_pb_text][et_pb_text admin_label=”Quote” background_layout=”light” text_font_size=”16″ text_line_height=”1.9em” use_border_color=”off” custom_margin=”-20px|||” background_position=”top_left” background_repeat=”repeat” background_size=”initial” _builder_version=”3.0.96″]
Figure 1. Raw data of IgG binding to Protein A at 111 nM, 37 nM, 12.1 nM, 4.1 nM on Channel 1 (red lines) and Channel 2 (blue/grey lines).
[/et_pb_text][et_pb_text admin_label=”Quote” background_layout=”light” text_orientation=”left” text_font_size=”16″ text_line_height=”1.9em” use_border_color=”off” border_color=”#ffffff” border_style=”solid” custom_margin=”-20px|||” background_position=”top_left” background_repeat=”repeat” background_size=”initial” _builder_version=”3.0.96″]
[/et_pb_text][/et_pb_column][/et_pb_row][et_pb_row background_position=”top_left” background_repeat=”repeat” background_size=”initial”][et_pb_column type=”4_4″]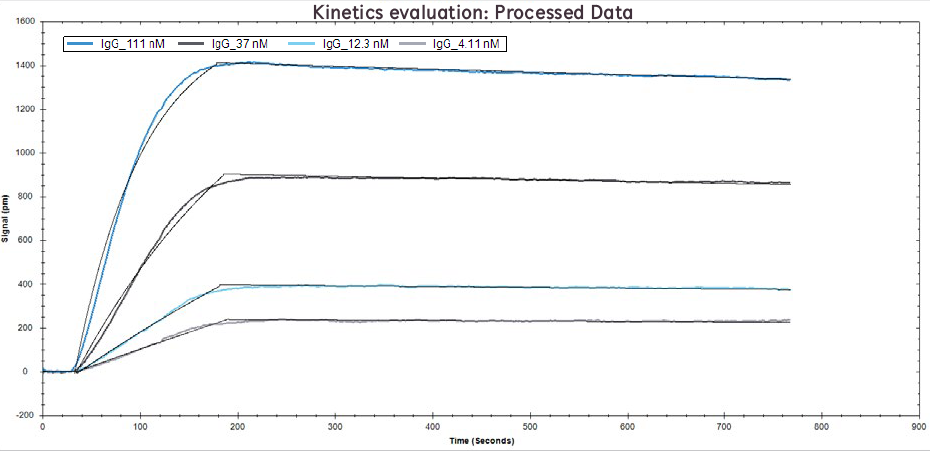 [et_pb_text admin_label=”Quote” background_layout=”light” text_orientation=”left” text_font_size=”16″ text_line_height=”1.9em” use_border_color=”off” border_color=”#ffffff” border_style=”solid” custom_margin=”-20px|||” background_position=”top_left” background_repeat=”repeat” background_size=”initial” _builder_version=”3.0.96″]
[/et_pb_text][et_pb_text admin_label=”Quote” background_layout=”light” text_font_size=”16″ text_line_height=”1.9em” use_border_color=”off” custom_margin=”-20px|||” background_position=”top_left” background_repeat=”repeat” background_size=”initial” _builder_version=”3.0.96″]
Figure 2. Processed data of IgG binding to Protein A at concentrations of 111 nM, 37 nM, 12.1 nM, and 4.1 nM. Solid black lines overlaid are the binding model fits.
[/et_pb_text][et_pb_text admin_label=”Quote” background_layout=”light” text_orientation=”left” text_font_size=”16″ text_line_height=”1.9em” use_border_color=”off” border_color=”#ffffff” border_style=”solid” custom_margin=”-20px|||” background_position=”top_left” background_repeat=”repeat” background_size=”initial” _builder_version=”3.0.96″]
[/et_pb_text][/et_pb_column][/et_pb_row][et_pb_row background_position=”top_left” background_repeat=”repeat” background_size=”initial”][et_pb_column type=”4_4″]
[table]
, OpenSPR
ka [1/M*s], 1.3 x 10⁵ (+ 2.1 x 100)
kd [1/s], 9.4 x 10⁻⁵ (+ 3.5 x 10⁻⁶)
KD [M], 0.76 x 10⁻⁹ (+ 2.0 x 10⁻¹¹)
[/table]
[et_pb_text admin_label=”Quote” background_layout=”light” text_orientation=”left” text_font_size=”16″ text_line_height=”1.9em” use_border_color=”off” border_color=”#ffffff” border_style=”solid” custom_margin=”-20px|||” background_position=”top_left” background_repeat=”repeat” background_size=”initial” _builder_version=”3.0.96″]
[/et_pb_text][et_pb_text admin_label=”Quote” background_layout=”light” text_font_size=”16″ text_line_height=”1.9em” use_border_color=”off” custom_margin=”-20px|||” background_position=”top_left” background_repeat=”repeat” background_size=”initial” _builder_version=”3.0.96″]
Table 1. Binding kinetics and affinity measured using OpenSPR between Protein A and Human IgG
[/et_pb_text][et_pb_text admin_label=”Quote” background_layout=”light” text_font_size=”16″ text_line_height=”1.9em” use_border_color=”off” custom_margin=”-20px|||” background_position=”top_left” background_repeat=”repeat” background_size=”initial” _builder_version=”3.0.96″ /][/et_pb_column][/et_pb_row][et_pb_row admin_label=”row” make_fullwidth=”off” use_custom_width=”off” width_unit=”on” use_custom_gutter=”off” padding_mobile=”off” allow_player_pause=”off” parallax=”off” parallax_method=”off” make_equal=”off” parallax_1=”off” parallax_method_1=”off” column_padding_mobile=”on” background_position=”top_left” background_repeat=”repeat” background_size=”initial”][et_pb_column type=”4_4″][et_pb_text admin_label=”Quote” background_layout=”light” text_font_size=”16″ text_line_height=”1.9em” use_border_color=”off” custom_margin=”-20px|||” background_position=”top_left” background_repeat=”repeat” background_size=”initial” _builder_version=”3.0.96″ /][et_pb_text admin_label=”Quote” background_layout=”light” text_font_size=”16″ text_line_height=”1.9em” use_border_color=”off” custom_margin=”-20px|||” background_position=”top_left” background_repeat=”repeat” background_size=”initial” _builder_version=”3.0.96″ /][et_pb_text admin_label=”Paragraph 2″ background_layout=”light” text_font_size=”16″ text_line_height=”1.9em” use_border_color=”off” custom_margin=”-20px|||” background_position=”top_left” background_repeat=”repeat” background_size=”initial” _builder_version=”3.0.96″]
[/et_pb_text][et_pb_cta button_url=”https://hubs.ly/H0dGnGR0″ url_new_window=”on” button_text=”Book a Web Demo” use_background_color=”off” background_layout=”light” header_text_color=”#1e73be” body_font_size=”16″ use_border_color=”off” custom_button=”off” button_icon_placement=”right” background_position=”top_left” background_repeat=”repeat” background_size=”initial” _builder_version=”3.0.96″]
[/et_pb_cta][/et_pb_column][/et_pb_row][/et_pb_section]