Surface plasmon resonance can be used to measure binding events because it is very sensitive to changes in refractive index. SPR instrument are made up of an optical measurement system, a fluid handling system, and a sensor chip.
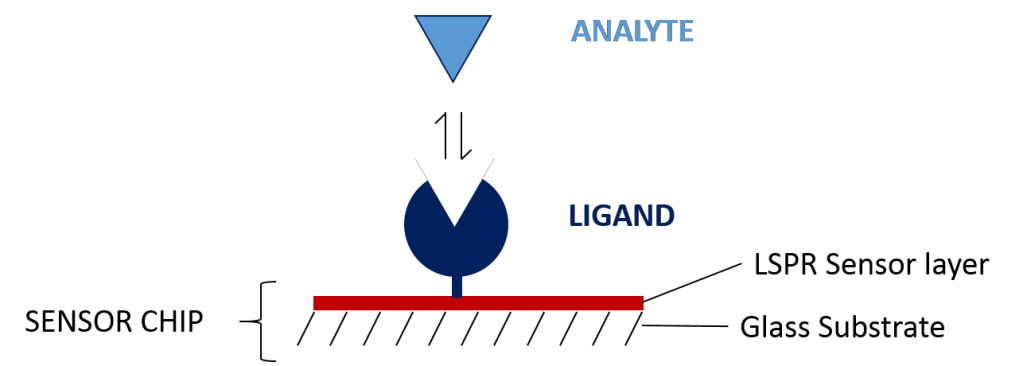
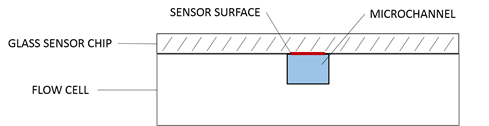
The sensor chip is a gold film coated on a glass substrate that has been chemically modified to make it easier to immobilize one of the binding partners onto the surface of the sensor. The molecule that is immobilized is known as the ligand, and the molecule in solution is known as the analyte. The sensor chip is interface with the fluidic system through the use of a small flow cell, so that the analyte can be injected at different concentrations in a very repeatable manner.
The fluidic system provides a continuous stream of buffer flowing through the flow cell and across the sensor chip, maintaining a very well controlled environment. The analyte is easily injected as a “plug” into the flowing buffer so that it will interact with the sensor surface for a specific amount of time. The fluidic system is also used for ligand immobilization, analyte regeneration, cleaning, and conditioning.
The optical system consists of a light source and a detector, and varies depending on the exact way in which the instrument is designed. The light source illuminates the gold film, and the detector measures the unique optical spectrum produced by the SPR phenomenon. Most SPR instruments utilize a laser that shines through a prism beneath the sensor chip, generating a total-internal-reflection condition. When this occurs, a plasmonic wave is generated on the surface of the gold, with the electrical field of this wave extending hundreds of nanometers into the space above the surface of the sensor. The reflected light will have a characteristic dip in intensity at a certain angle due to the plasmonic wave, which is measured with a detector. When a molecule binds to the surface of the sensor chip, the refractive index of the space in which the plasmonic wave is propagating through changes, and the reflectance angle will shift. The amount it shifts depends on how much mass of material has bound to the surface, and the shift can be measured in near real time.
What Happens in an SPR Experiment?
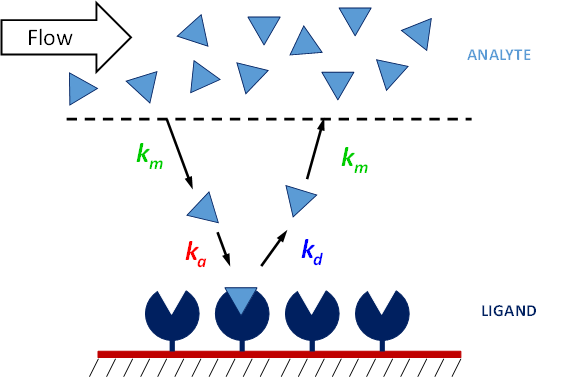
In a typical SPR experiment, the first step is to immobilize the ligand to the sensor surface. There are a number of different types of sensor surfaces and methods to do this, as explained in our blog post. Once the ligand is immobilized the remaining binding sites are blocked, and the surface often conditioned with injections of regeneration buffer. Running buffer is being continuously run over the surface of the sensor chip, and once the surface is stable, the analyte is injected at a specific flow rate for a specific amount of time (usually 2-5 minutes) and at a specific concentration. The time in which the analyte is passing through the flow cell is known as the association phase, and the analyte will accumulate on the surface as it binds to the ligand. The rate of binding will depend on the on-rate of the interaction, as well as the mass transport of the analyte from the bulk to the surface. This why it is important to maintain a high flow rate and use a low ligand density, so that the concentration of analyte at the surface will remain high. Binding of the analyte to the ligand will cause the signal to increase until equilibrium is reached (if it is reached). Once the analyte passes through the flow cell and is replaced with buffer, the analyte will start to come off the surface, and the signal will begin to decrease. This is known as the sensorgram. If the ligand and analyte bind strongly, a regeneration buffer will be injected to break up the ligand-analyte complex, leaving the ligand on the surface. The analyte injection is repeatable multiple times for 3-5 different concentrations, which is needed in order to obtain reliable kinetic constants.
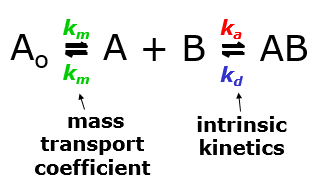
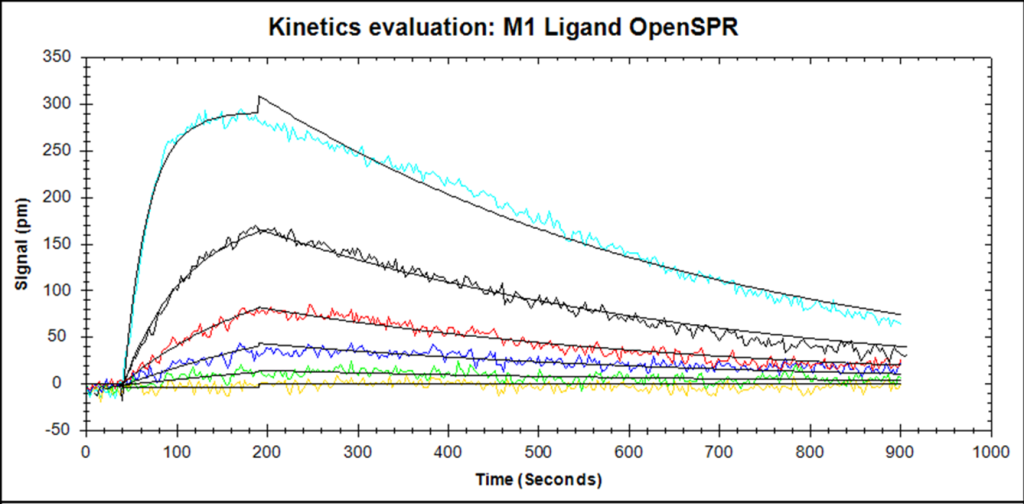
Once the experiment is complete, the user has a set of binding curves that can be mathematically fit with binding models to extract the on rate, off rate, and affinity. Good binding curves should be exponential. A 1:1 binding model is the simplest, but corrections for mass transport and more complex binding models can be added. The set of analyte curves are globally fit, so a single kon and koff are generated for the entire data set.
Make your next scientific breakthrough with SPR
Are you looking to obtain affinity and kinetics data for your next publication? To help you get started, we’ve gathered our expertise on this information-rich technique into a handy eBook.