[et_pb_section bb_built=”1″ fullwidth=”off” specialty=”off” disabled_on=”on|on|on” disabled=”on”][et_pb_row make_fullwidth=”off” use_custom_width=”off” width_unit=”on” use_custom_gutter=”off” custom_padding=”||-10px|” padding_mobile=”off” allow_player_pause=”off” parallax=”off” parallax_method=”off” make_equal=”off” parallax_1=”off” parallax_method_1=”off” column_padding_mobile=”on”][et_pb_column type=”4_4″][et_pb_text background_layout=”light” text_orientation=”justified” text_font_size=”16″ text_line_height=”1.9em” use_border_color=”off” border_color=”#ffffff” border_style=”solid” custom_margin=”-25px|||”]
There are many techniques available that can provide scientists with the affinity of an interaction between two biomolecules. The affinity describes how strong the interaction is between two biomolecules. Extremely strong interactions can be on the order of picomolar affinities, while weak interactions can be in the millimolar range, with many interactions falling within this range. Mathematically, the affinity is the concentration of analyte at which half of all binding sites are occupied (at equilibrium conditions). This concept is depicted in the figure below:
[/et_pb_text]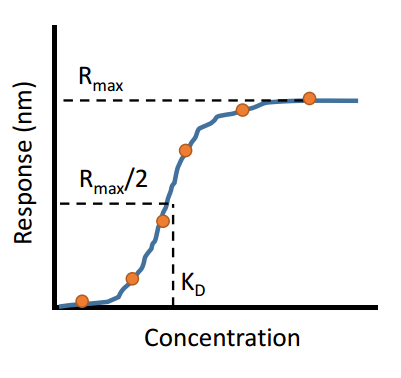 [et_pb_text background_layout=”light” text_orientation=”left” text_font_size=”16″ text_line_height=”1.9em” use_border_color=”off” border_color=”#ffffff” border_style=”solid” custom_margin=”-20px|||” background_position=”top_left” background_repeat=”repeat” background_size=”initial”]
Blog Overview
- Binding affinity is just the tip of the iceberg
- Understanding binding kinetics
- Same affinities, different kinetics
Binding affinity is just the tip of the iceberg
[/et_pb_text][et_pb_text background_layout=”light” text_orientation=”justified” text_font_size=”16″ text_line_height=”1.9em” use_border_color=”off” border_color=”#ffffff” border_style=”solid” background_position=”top_left” background_repeat=”repeat” background_size=”initial”]
The binding affinity of an interaction can be measured by techniques such as ELISA, fluorescence assays, radioactive assays, quantitative pull-downs, etc. The binding affinity is an important number, but it doesn’t tell the whole story. Much like we mentioned in our previous blog post, affinity is really only the tip of the iceberg when it comes to understanding the nature of an interaction. Two other very important aspects to examine are kinetics, how fast the interaction happens, and specificity, how specific the interaction is between the two molecules. This type of information is critical for understanding the biological system that is being studied, especially for applications like drug discovery applications and understanding molecular disease mechanisms.
[/et_pb_text][et_pb_text background_layout=”light” text_orientation=”left” text_font_size=”16″ text_line_height=”1.9em” use_border_color=”off” border_color=”#ffffff” border_style=”solid” background_position=”top_left” background_repeat=”repeat” background_size=”initial”]
Understanding binding kinetics
[/et_pb_text][et_pb_text background_layout=”light” text_orientation=”justified” text_font_size=”16″ text_line_height=”1.9em” use_border_color=”off” border_color=”#ffffff” border_style=”solid” background_position=”top_left” background_repeat=”repeat” background_size=”initial”]
Measuring the kinetics of an interaction is extremely important as it reveals the time component of the interaction. Think of binding kinetics as the pathway the ligand and analyte must take to define the affinity. As a basic example, you can reminisce about a fun drive to the summer cottage.
[/et_pb_text] [et_pb_text background_layout=”light” text_orientation=”justified” text_font_size=”16″ text_line_height=”1.9em” use_border_color=”off” border_color=”#ffffff” border_style=”solid” background_position=”top_left” background_repeat=”repeat” background_size=”initial”]
There are two paths you can take to reach the cottage (the affinity): the scenic route and the highway. Your friends decide to take the highway, while you choose the scenic route. In the end, you both reach your final destination, but the path you took to get there was very different and impacts your overall cottage experience. The highway might have been faster, but your friends were stuck in traffic most of the time. The scenic route might have required more driving time, but it was a less stressful drive. Overall, you both reached the cottage, but when your lab members ask about your weekend the following Monday, you will have different experiences to share. In the same way, the on and off rates define the affinity in binding kinetics.
[/et_pb_text][et_pb_text background_layout=”light” text_orientation=”left” text_font_size=”16″ text_line_height=”1.9em” use_border_color=”off” border_color=”#ffffff” border_style=”solid” background_position=”top_left” background_repeat=”repeat” background_size=”initial”]
Same affinities, different kinetics
[/et_pb_text][et_pb_text background_layout=”light” text_orientation=”justified” text_font_size=”16″ text_line_height=”1.9em” use_border_color=”off” border_color=”#ffffff” border_style=”solid” background_position=”top_left” background_repeat=”repeat” background_size=”initial”]
Consider the following examples of real time binding curves measured using surface plasmon resonance (SPR). All 4 curves have the exact same affinity, so on the surface all of these interactions would appear to be identical. But when you examine the kon and koff rates, or the kinetics of the interaction, you see that each interaction gets to the same affinity (KD) in very different ways. The binding constants of each interaction differ by 4 orders of magnitude, yet all have the same affinity.
[/et_pb_text]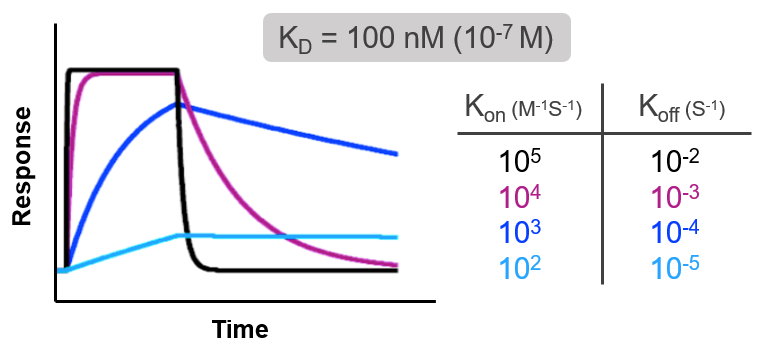 [et_pb_text background_layout=”light” text_orientation=”center” text_line_height=”1.9em” use_border_color=”off” border_color=”#ffffff” border_style=”solid” custom_margin=”-7px||-25px|” background_position=”top_left” background_repeat=”repeat” background_size=”initial” module_alignment=”center”]
Compounds have the same affinity even though the binding constants vary by 4 orders of magnitude
[/et_pb_text][et_pb_text background_layout=”light” text_orientation=”justified” text_font_size=”16″ text_line_height=”1.9em” use_border_color=”off” border_color=”#ffffff” border_style=”solid” background_position=”top_left” background_repeat=”repeat” background_size=”initial”]
Some compounds have extremely high on rates, meaning there is very little energy needed to form the interaction, but also very high off rates, meaning once the interaction is formed it is relatively weak. Other compounds have much lower on rates, meaning it is difficult for the two molecules to get into a conformation to interact, but once they do, the interaction is extremely strong so the off rate is very low. Without knowing the kinetics, the true nature of an interaction cannot be known. This is why techniques like SPR, which give detailed insight into interactions, are becoming necessary not only for publications but for the advancement of many fields of medicine and medical research.
[/et_pb_text]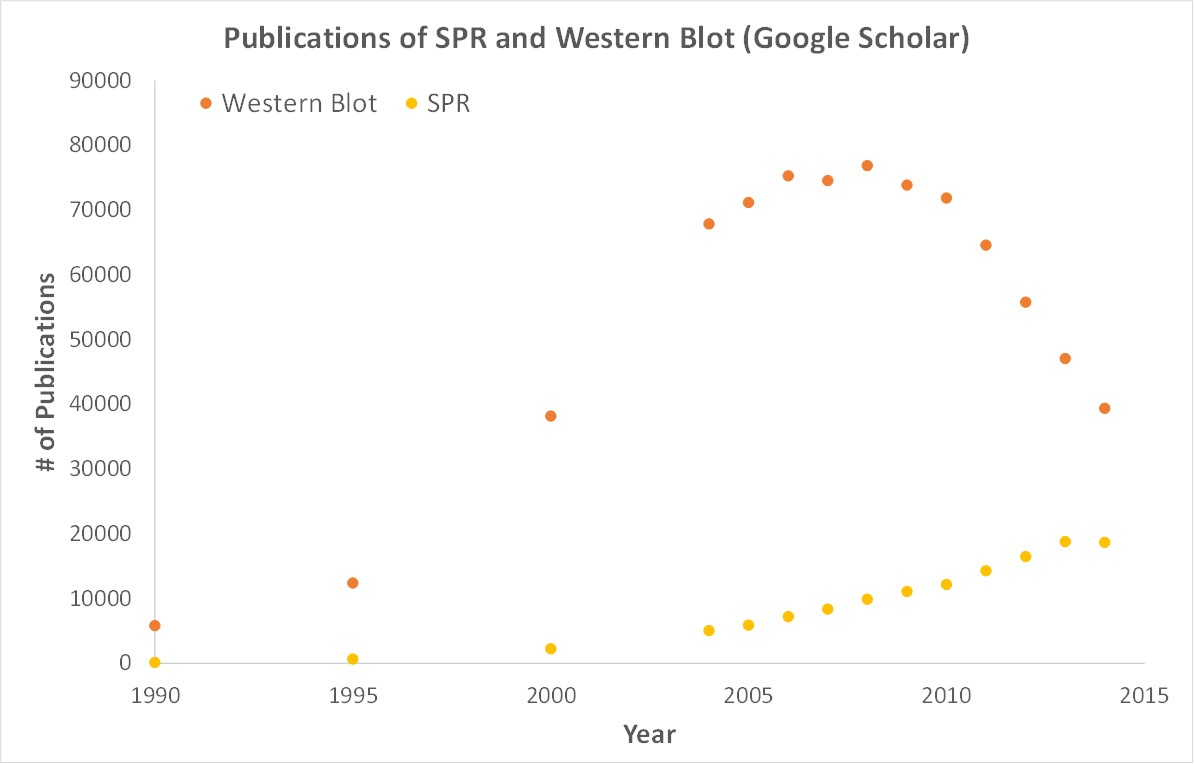 [et_pb_text background_layout=”light” text_orientation=”justified” text_line_height=”1.9em” use_border_color=”off” border_color=”#ffffff” border_style=”solid” background_position=”top_left” background_repeat=”repeat” background_size=”initial”]
Scientific publications involving SPR have increased drastically over the years. SPR is gaining attention while traditional techniques like Western blots are becoming less important.
[/et_pb_text][/et_pb_column][/et_pb_row][et_pb_row admin_label=”row” disabled_on=”on|on|on” disabled=”on” background_position=”top_left” background_repeat=”repeat” background_size=”initial”][et_pb_column type=”4_4″][et_pb_text background_layout=”light” text_orientation=”left” text_font_size=”16″ text_line_height=”1.9em” use_border_color=”off” border_color=”#ffffff” border_style=”solid” custom_margin=”-65px|||”][/et_pb_column][/et_pb_row][/et_pb_section]