Summary
- Binding kinetics of biotinylated CD16a and IgG were characterized by comparing OpenSPR™ with a standard SPR instrument and a commonly-used BLI instrument.
- KD values measured using the OpenSPR™, the standard SPR instrument and the commonly-used BLI instrument were found to be 74.7 nM, 48.7 nM and 226 nM, respectively.
- This study supports the equivalency of OpenSPR™ with other commercial instruments for the analysis of binding kinetics and affinity.
The OpenSPR™ is a powerful instrument providing researchers with in-depth label-free binding kinetics for a variety of different molecular interactions. A side by side comparison study was performed with OpenSPR™, a standard SPR instrument, and a commonly-used BLI instrument to demonstrate that OpenSPR™ can provide the same high-quality data as commonly-used instruments on the market. The standard SPR and BLI instruments are used for analyzing binding kinetics, but cost hundreds of thousands of dollars, making them inaccessible to many researchers who need this data. An Fc-FcR interaction was analyzed using the three instruments under similar conditions to show that the OpenSPR™ can generate comparable results to both the standard SPR and commonly-used BLI systems for a fraction of the cost.
How much does OpenSPR™ cost compared to the other SPR and BLI instruments?
OpenSPR™ is a benchtop SPR solution that provides researchers with the ability to complete in-depth label-free binding kinetics in their own lab. Other SPR or BLI instruments in the pharmaceutical industry, cost hundreds of thousands of dollars. With OpenSPR™, you can get the same high-quality data from the convenience of your own lab and for a fraction of the cost of these instruments. This allows researchers to accelerate their research and publish faster.
Comparison Study: Analyzing an Fc-FcR Interaction using OpenSPR™, a standard SPR instrument, and commonly-used BLI instrument
In this study, we measured the binding kinetics of an Fc-FcR interaction on the OpenSPR™, a standard SPR instrument, and a commonly-used BLI instrument. The standard SPR and BLI experiments were run by trained technicians from a CRO and the OpenSPR™ experiment was run by a Nicoya scientist. The goal of this study was to support the equivalency of OpenSPR™ with other commercial instruments for the analysis of binding kinetics and affinity. The kon, koff, and KD of the Fc-FcR interaction was determined and compared using kinetic analysis. If you’d like to know more about the materials, protocol and equipment used in this comparison, you can view our detailed technical note here. Now, let’s take a look at the data:
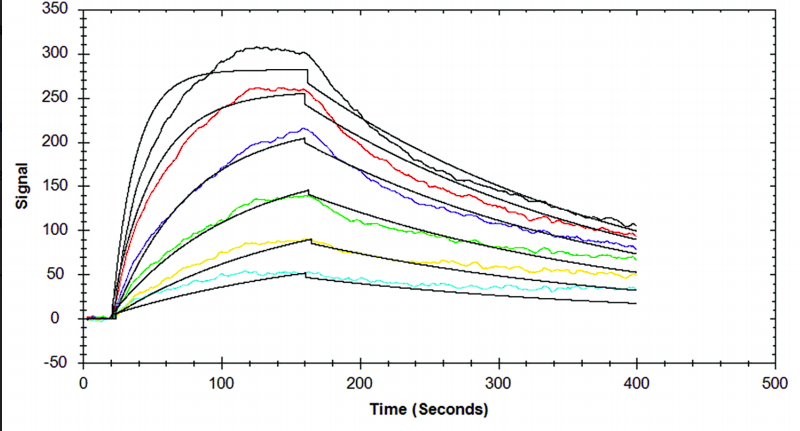
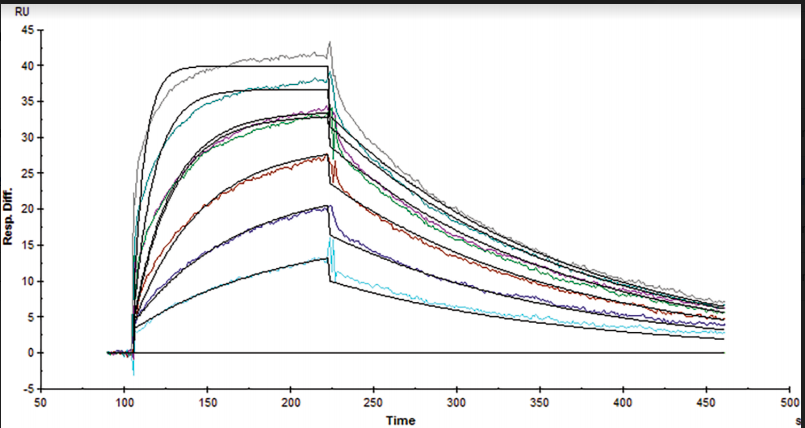

Table 1. Kinetic and affinity constants of the CD16a-Fc interaction measured on OpenSPR™, the standard SPR instrument, and commonly-used BLI instrument.
| OpenSPR™ | Standard SPR Instrument | BLI Instrument | |
| kon | 5.57e4 | 1.42e5 | 2.68e4 |
| koff | 4.16e-3 | 6.89e-3 | 6.08e-3 |
| kd | 7.47e-8 | 4.87e-8 | 2.26e-7 |
Results
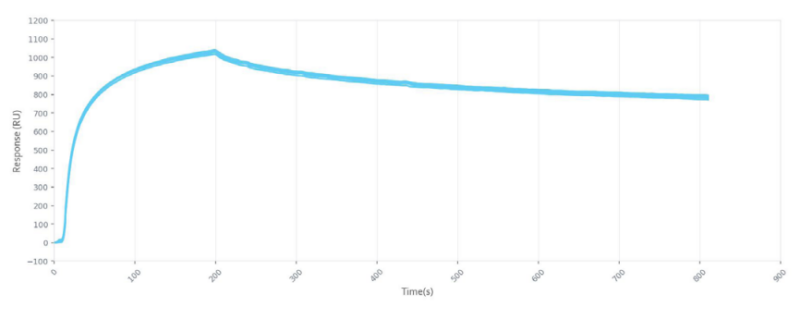
Results from the Fc-FcR interaction measured on the OpenSPR™, standard SPR and BLI instruments can be found in Figures 1, 2 and 3, respectively. Data was fit in each experiment with a 1:1 binding model. The OpenSPR™, and the two other instruments determined KD values of 74.0 nM, 48.7 nM and 226 nM, respectively. The calculated KD values between OpenSPR™ and the other SPR instrument are highly-comparable, while the value reported by the BLI instrument differs by ~5X. The kinetic constants determined from the fits are shown in Table 1. The off-rates are similar across all three instruments, however, the BLI-derived on-rates differ by over an order of magnitude. The quality of the fits is comparable for OpenSPR™ and the standard SPR instrument, but there is more deviation from the model seen in the BLI data.
It is common to see variations in measured affinity and kinetic values even when running assays on the same instrument. The closeness of the values between both SPR instrument experiments demonstrates the comparability of these instruments for biomolecular interaction analysis. The relatively large difference seen in the BLI data could be due to the higher immobilization level used, fitting differences, or fundamental differences in the dip and read technique used with BLI.
Conclusion
In summary, the OpenSPR™ and the other SPR instrument reported similar kinetics and affinity values but differed more significantly form the BLI system for the interaction studied. This supports the use of OpenSPR™ for affordable and benchtop characterization of accurate binding interactions. For a full list of publications using OpenSPR binding kinetics and affinity data, click here.