Are protein binding kinetics important for your research? Benchtop SPR is a user-friendly tool that allows researchers to characterize biomolecular interactions in real-time measurements. Forget CO-IPs that takes days to run and only give end-point measurements, or techniques that use too much precious sample like ITC. In this blog post, we discuss how OpenSPR™ can be used to analyze protein-protein interactions. Read on to find out how you can publish your protein data faster with benchtop SPR. 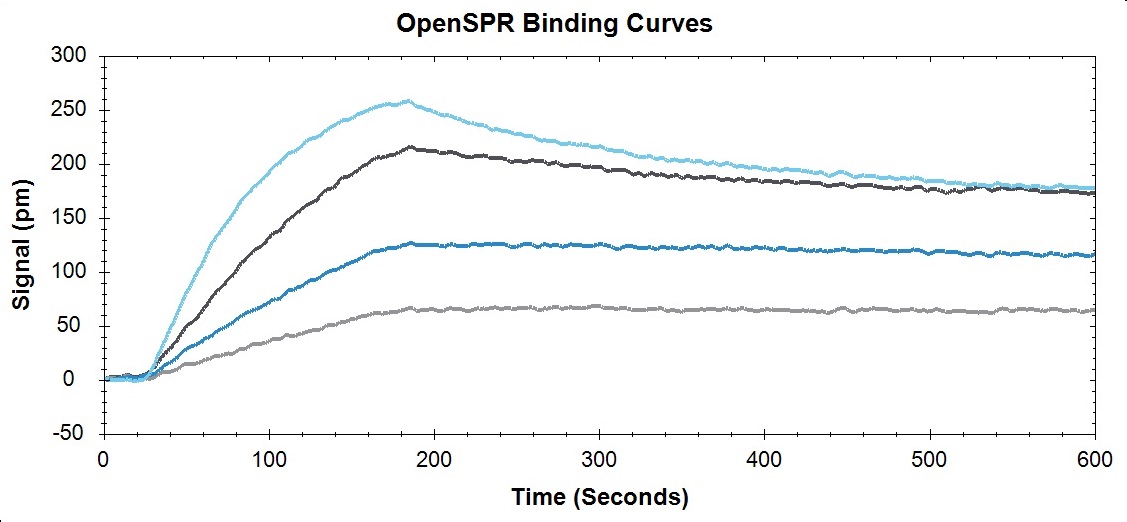
Binding curves and kinetic analysis of protein-protein interaction on OpenSPR™.
Why do we study protein-protein interactions?
Protein-protein interactions are important for biological processes at both cellular and systems levels. These processes include including gene expression, cell growth, cell cycle control, morphology, motility, intercellular communication and apoptosis. Studying how proteins interact with each other and identifying biological networks is vital to understanding how proteins function within the cell, and the majority of researchers will rely on this type of analysis at some point in their research in order to publish.
Why do researchers use SPR to characterize protein-protein interactions?
Surface plasmon resonance (SPR) can be used to analyze all types of interactions including protein-protein, protein-small molecule, protein-nucleic acid, protein-aptamer, protein-lipid, protein-carbohydrate, and many more. Techniques such as protein affinity chromatography, sedimentation, gel filtration columns and fluorescence methods can also be used to study these interactions. However, many of these techniques require complex labelling steps or expensive, complex instrumentation. In addition, most of these techniques only give endpoint measurements such as yes/no binding or affinity. In order to publish, more detailed and quantitative data is needed to fully characterize protein interactions and complement the other techniques being used.
In recent years, many researchers have turned to SPR to characterize their biomolecular interactions as a sensitive and quick approach that also provides real-time measurements. SPR is a label-free technology which allows researchers to quantitatively analyze binding between two biomolecules. SPR technology allows you to determine the kon, koff and KD of interactions, providing deeper insight into binding events compared to other techniques that only give endpoint measurements. SPR is a versatile technique as it can also be used to determine protein concentration.
Example of a protein-protein interaction analyzed using OpenSPR™
Below is an example of how OpenSPR™ was used to analyze the on rate, off rate, and affinity constant of a protein-protein interaction. In conclusion, a simple experiment that uses minimal sample was conducted to extract powerful data and insight into the binding nature of this biomolecular system. You can find the full study here.
Binding curves and kinetic analysis of protein-protein interaction on OpenSPR™.